Overview
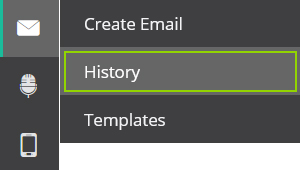
After you’ve sent an email, the Email History dashboard gives you a view of how your contacts interact with the message. The page houses all your email messages, including those that have been sent, saved during composition, and those that were sent for approval and rejected. You can also view in-depth reports on your emails using our detailed reports. To view your email history, hover over the envelope icon in the left-hand navigation bar and click History.
History Dashboard
Tutorial Video
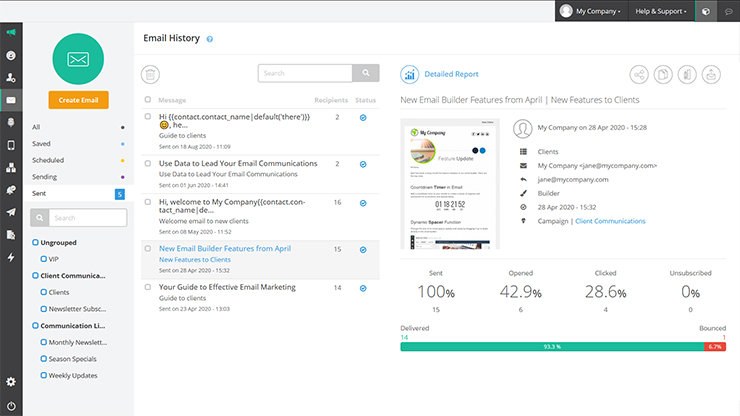
The History dashboard is divided into three sections:
- The menu on the left, that you can use to filter your previous emails by email status, campaign, or contact list
- The list of your previous emails in the middle
- The email preview, properties, and basic reporting pane on the right
Email Preview
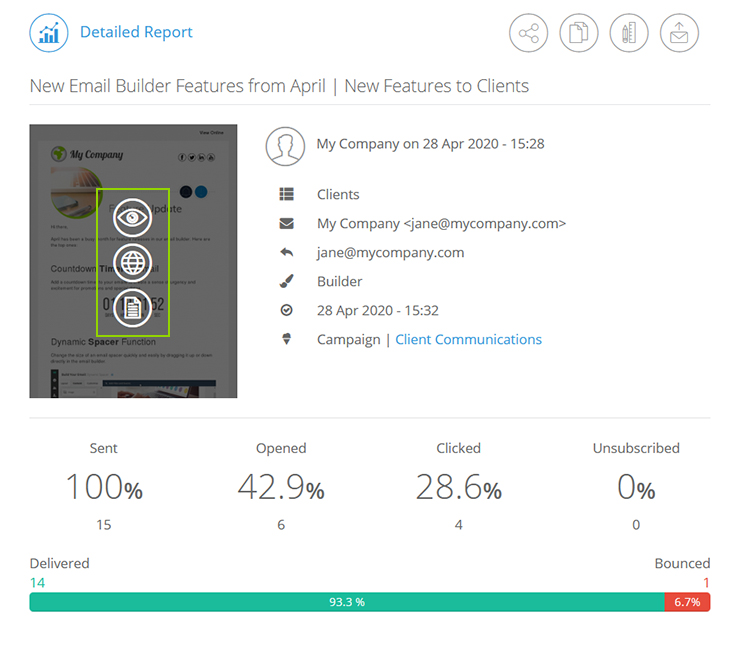
The email preview shows you a thumbnail of your email. Hover over the thumbnail to view the full-sized email on the platform, online, or as a PDF.
Email Properties
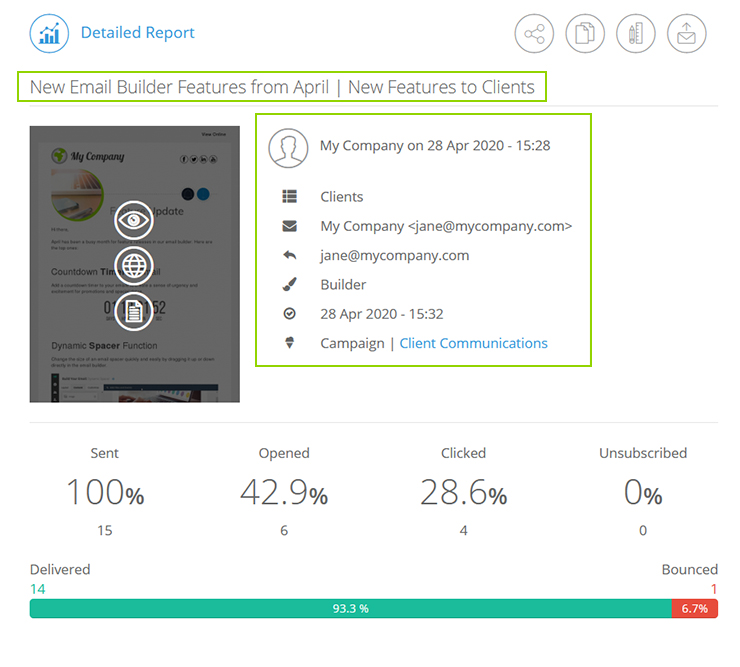
The email properties you can view on the dashboard include:
- The email subject line
- Email created date & time
- The chosen contact list
- List filters (if applicable – hover over the blue funnel icon)
- From email address
- Email composition method
- Scheduled date and time
- Sent date & time
- Campaign name (if specified)
Basic Reporting
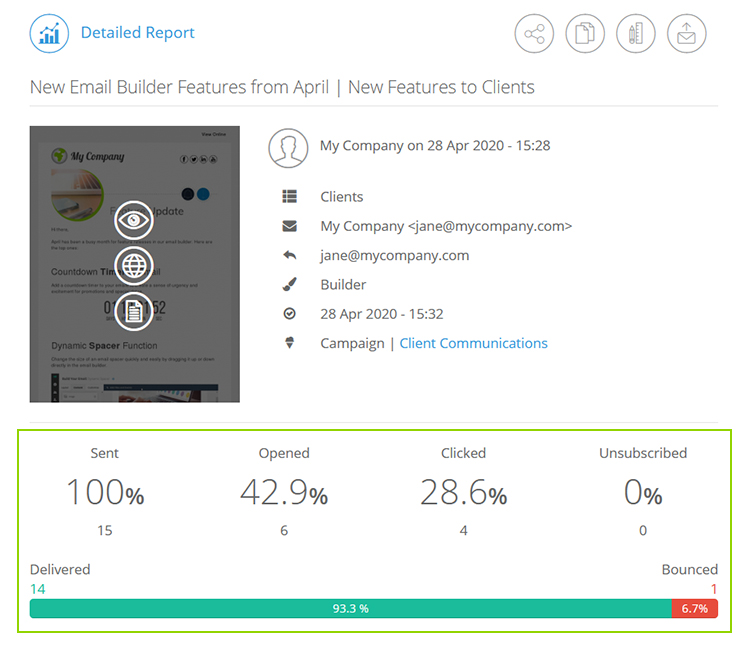
At the bottom of this view, you’ll see basic reporting for your email, including:
- Sent: The number of emails that sent
- Opened: The percentage and estimated number of contacts that opened your email
- Clicked: The percentage and estimated number of contacts that clicked on a link in your email
- Unsubscribed: The percentage and estimated number of contacts that unsubscribed from this email list
- Delivered: The percentage and number of contacts that your email was delivered to
- Bounced: The percentage and number of emails that bounced
Reporting Action Bar
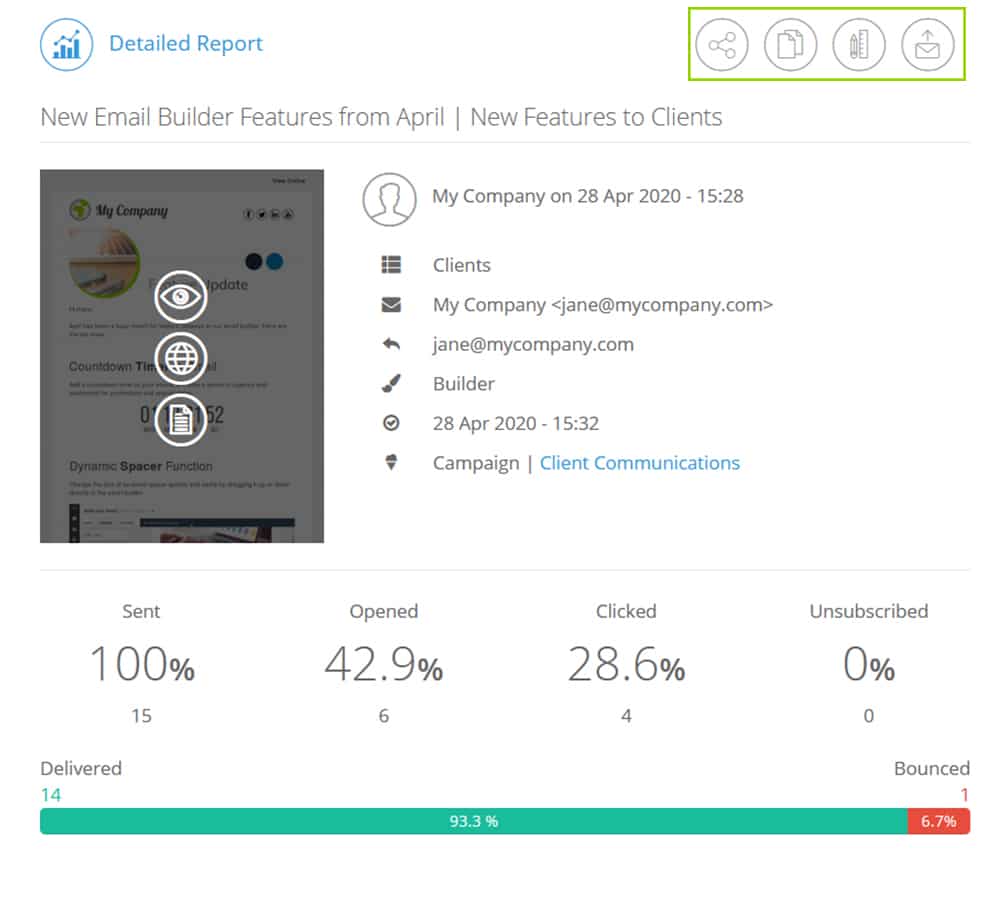
In the top right-hand corner of this dashboard, you’ll also see some action buttons. These include:
- Share the report with someone via email, or by sharing a direct link (you can also enable the viewer to export the data)
- Re-create your email so you can send a version of it again
- Create a template from your email
- Resend the email to a specific email address
Detailed Reports
To see detailed reporting on your email, click on the email you want to see reports on and click the blue Detailed Report button. This will open the reporting dashboard for that email. Toggle between the reporting options using the menu on the left.
The action bar in the top left of the screen allows you to:
- Preview your email
- Re-create your email so you can send a version of it again
- Create a template from your email
- Share the report with someone via email, or by sharing a direct link (you can also enable the viewer to export the data)
- Print the details of the overview report stats

Overview Report
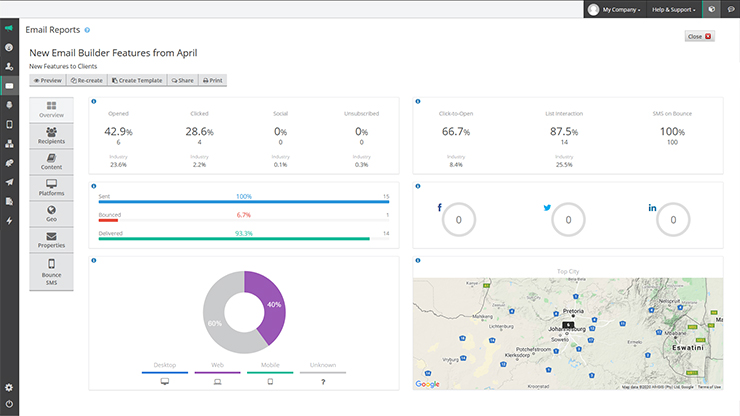
This report gives you a more in-depth overview of the email statistics. These include:
- Basic engagement stats: unique opens, clicks, social shares, and unsubscribes, compared to the averages in your industry
- Rich engagement stats: This uses the basic engagement stats to derive:
- Click-to-open rate: The percentage of your contacts who opened the email who also clicked on a link in the email)
- List interaction: The average percentage of your list that interacted with your messages (read, clicked, updated profile, unsubscribed, etc) in any way over the last three months
- SMS on bounce: The percentage of your contact list that received an SMS to update their contact details when their email bounced
- Delivery stats: The percentage of emails that were sent, bounced, and delivered
- Social stats: The percentage of your contacts who used the social sharing icons in your email to share it on Facebook, Twitter, or LinkedIn
- Platform stats: A pie chart of the devices used to open your email
- Top city: Shows where in the world the contacts that opened your email are and how many times your email was opened there (may not be accurate if contacts use VPN)
- Storing reporting data: We store the reporting data for all email reports for a period of 12 months from the date the email was sent.
- Accessing data: After your 12-month storage limit has been reached, your reporting data will no longer be accessible in the platform.
Recipient Report
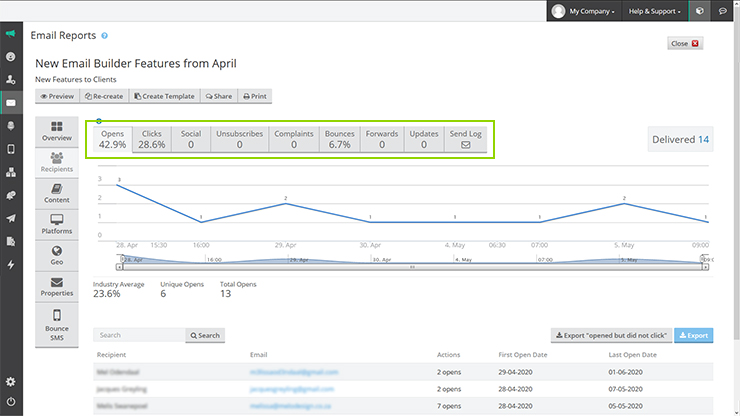
The recipient report shows in-depth statistics on contact activity. All the sub-reports on this page use an interactive graph to present recipient activity. Drag the sliders above the scroll bar to zoom in on a specific time frame. You can also hover your mouse over the graph for a breakdown of the open statistics at that specific time.
Use the tabs above the graph to toggle between the following detailed views:
Opens
This screen shows a graph of the number of opens over time, as well as a list of recipients who opened the email. Opens record the total number of times the email was opened, while unique opens are counted once per contact who opens the email. The former can result in a higher open statistic if a single contact opens an email more than once.
The table below shows all the contacts who have received the email. It also shows how many times they opened it and their most recent interaction with it.
Use the search bar to find a specific contact or export the entire table by clicking on Export.
Clicks
This shows the number of times the links within your email were clicked. Unique clicks are counted once per contact, per link. Total clicks record the total number of times links in the email were clicked. This includes multiple clicks by a single contact.
The table below shows all the contacts who have clicked on links within the email. It also shows how many times they clicked links and their most recent interaction with the email.
Use the search bar to find a specific contact or export the entire table by clicking on Export.
Social
This shows you detailed social interaction statistics. Don’t be worried if your social numbers are low; they tend to be low across many industries. The contact activity table shows details of which contacts viewed your email in a social media network. It shows how many times they viewed the email and their most recent interaction with it.
Use the search bar to find a specific contact or export the entire table by clicking on Export.
Unsubscribed
This shows details of contacts who unsubscribed from your list through this email. The table below shows which contacts unsubscribed, their email address, why they unsubscribed (if they shared this), and the date of their most recent interaction with the email.
Complaints
This shows details of contacts who complained about this email. The table below shows which contacts complained about the email, their reason for the complaint, and the date of their most recent interaction with the email.
Bounces
This tab shows details of contacts whose email addresses bounced this email. The pie chart below shows the top five bounce reasons.
Forwards
This tab shows details of contacts who forwarded this email using the forward link in the email itself. The table below shows details of which contacts forwarded this email and their most recent interaction with it.
Updates
This tab shows details of contacts who updated their details via the link in this email. The table below shows details of the contacts who updated their details and their most recent interaction with it.
Send Log
This tab shows all the recipients this email was sent to. It includes their email address, the status of the email (whether it was sent or bounced), and the date that the email was sent.
Use the search bar to find a specific contact or export the entire table by clicking on Export.
Note: If the numbers shown on these graphs are greater than 1% of your recipients, this will be shown as a percentage. If it’s less than 1%, it will be shown as a whole number.
The Single Contact Page
You’ll see that the send log email addresses are clickable. When you click on one of these email addresses, it’ll take you to a view of that individual’s contact’s data and activity. The information you can browse through includes:
- The contact’s general data: name, email address, mobile number, gender, marital status, birthday, date and time created, contact ID, custom contact ID, and contact score. You can click on any of the data fields to update the contact’s data directly from here.
- General information: The information you have in the platform’s standard fields, like title, address, country, and company. You can click on any of the data fields to update the contact’s data directly from here.
- Custom fields: The data you have on the contact within the custom fields you’ve created. You can click on any of the data fields to update the contact’s data directly from here.
- Activity log: A log of the contact’s activity since their data was captured in the platform. Click on the names of the messages they’ve engaged with and the platform will direct you to the detailed report for that message.
- Engagement by channel: An overview of engagement stats like the opens, clicks, delivery, purchases, etc, by email, SMS, voice broadcasting, and ecommerce.
- Lists: A view of the lists this contact is on and if they’re subscribed via email, mobile, or push. You can search through the lists using the search bar. You can also hover over the relevant channel on a specific list and use the drop-down to subscribe, unsubscribe, or remove a contact directly from here. You can also send them an email to confirm their subscription by clicking Send Confirmation Email.
- Workflows: A view of the workflows the contact is on or has been through. If you hover over the workflow name, you can also see when they entered the workflow. Click on the relevant workflow name and it’ll direct you to that workflow report.
Content Report
The email content shows detailed information about how your recipients interacted with the links in your email. It’s split into to two tabs:
- Heatmap
- Links
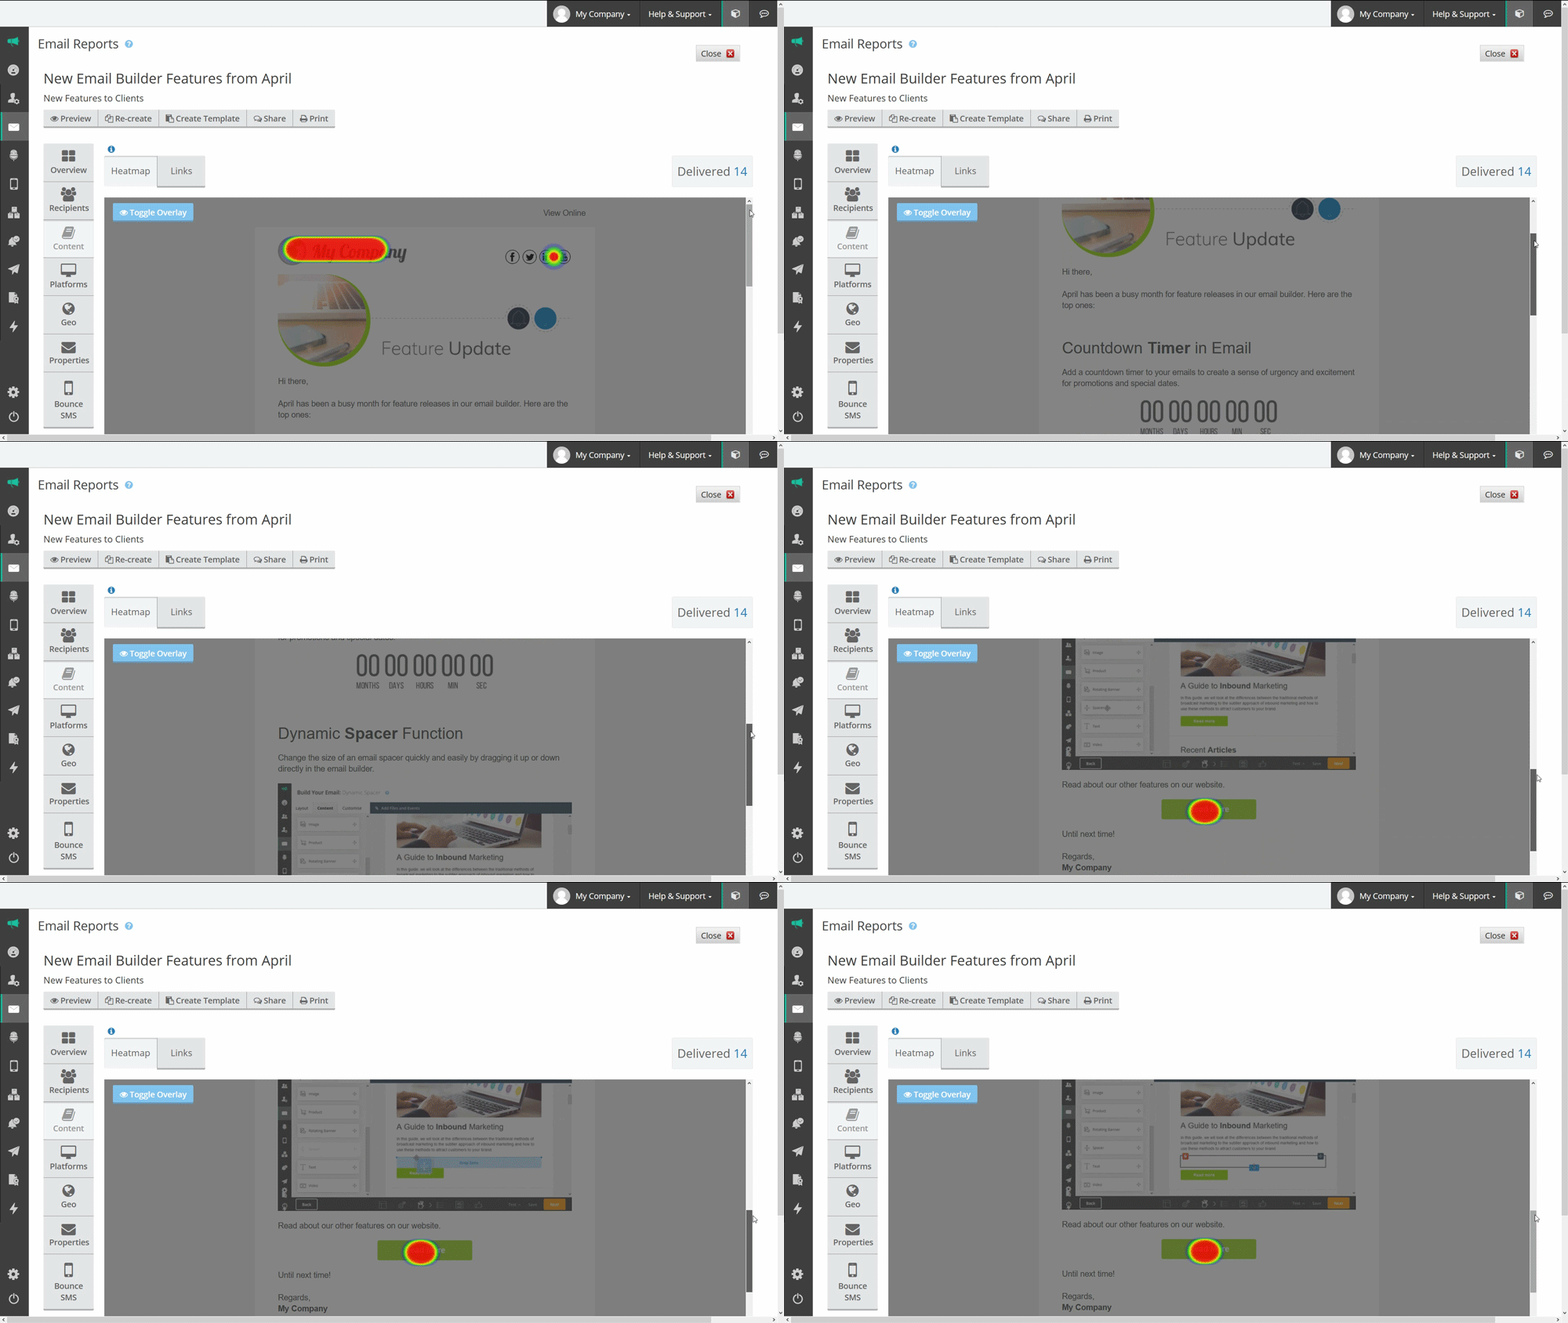
1. Heatmap
This shows you a heat map of the links clicked in your email. It can help you identify the most popular links in your email at a glance and help you to test the effectiveness of your email layout.
The more popular (‘hotter’) the link is, the redder the colour. Cooler blue colours show the links that were least clicked.
2. Links
On this tab, you can view when the links were clicked over time, the click statistics below (including CTOR: click-to-open rate, or the percentage of your contacts that opened your email that also clicked on a link in the email), and a hierarchy of the top performing links.
You can export this table by clicking Export.
Important:
As of January 2023, we’re changing two table headings in the Content section of the Detailed Report to align better with industry standard terminology.
- “Unique Clicks” will be changed to “First Click”, which indicates the total unique contacts who click a specific link first from all the other links in an email. It gives an indication of which content prompted the recipient to engage with your email.
- “Recipients” will be changed to “Unique Clicks”, which indicates the total number of contacts who have clicked on any link in your email.
Also note that the way these metrics are calculated has not changed, and that the table headings have simply been updated.

Tracked Attachments Report
The tracked attachments tab only shows if you've added an attachment to the email and specified that you want to track attachments in the sending settings before you sent the email. This tab shows you:
- Total unique downloads
- Number of repeat downloads
- The download-to-open rate (of the people who opened your email, this shows the percentage who downloaded the attachment)
- Total downloads vs unique downloads
- The attachment itself
- The recipients who downloaded the attachment, how many times they downloaded it, and when
Platform Report
Platform reporting shows you the top-performing devices and browsers that your emails are opened on. This can help you optimise your email design by identifying which desktop email clients (e.g. Outlook, Thunderbird, Lotus Notes), webmail clients (e.g. Gmail, Yahoo, Hotmail), and mobile browsers (e.g. Safari, Blackberry, Android) your contacts use to open your emails.
The platforms report is split into four tabs:
- Desktop
- Web
- Mobile
- Unknown
Each of these tabs shows opens on these platforms over time, a pie chart of the top email clients used per platform, and the actual number of contacts who opened your email on these programs.
Geo Report
The Geo report shows you where in the world your readers are accessing your email. You can toggle between the Opens and Clicks views to see if there are any geographic locations that stand out for either. Click on the numbers to get a closer look at where your recipients are reading your email. You can also switch between the Map and Satellite view by clicking the appropriate button in the corner of the map.
On the right side of the map, you’ll see the top five countries where your email was viewed the most, and the total number of countries and cities where your email was opened.
Below the map is a table showing information like:
- Recipients who opened the email, by name and email address
- The country each recipient was in when they opened the email
- The number of times they clicked or opened the email
- The most recent date on which they opened or clicked on the email
You can search for a specific recipient in this table using the search box. You can also export the table by clicking Export.
Properties Report
This tab shows you all the properties and settings associated with this email, including:
- Email preview: In the top-left you can preview the email
- Message properties box that shows:
- The email subject
- Description
- From name and address
- The reply email address
- Overview box that shows:
- The total number of contacts you sent to
- The lists you sent the email to
- The filters applied to these lists (if applicable)
- The size of the email
- Any email attachments
- Any scheduling applied to the email
- Any staggering or rate-limiting applied to the mail
- Email settings tabs, including:
- Composition: Who created the email, when it was created, and which composition method was used
- Lists: Which lists the email was sent to, the number of recipients, basic filters used, and import filters used
- Sending Options: Whether email notifications were sent and which language the email was sent in
- Tracking: Which of the tracking options were used and the name of the Google Analytics tab used, if applicable
- Footer: The standard links included in your email footer
- Social: The social media links included in your email
- Approval & Reports: If the message was marked for approval and by whom, whether the email report was set to be shared automatically
SMS-on-Bounce Report
If you have SMS-on-Bounce activated on your account, our platform will automatically SMS contacts when their email addresses bounce. This SMS will request that they provide an updated email address. If the contact responds with their correct address, the system will automatically update the customer's details with the correct address.
Note: you must have a valid mobile number for the contact for SMS-on-Bounce to work. You must also have SMS credits available, as this validation costs two SMS credits. To enable SMS-on-Bounce on your account, please contact support.
This report shows the details of the contacts who received an SMS on bounce. These details include:
- Recipient name
- Email address
- Mobile number
- Date that the SMS was sent
- Message received by the recipient
- The recipient’s reply
- Update status (if the contact details were updated in your list)

